FREE UK tracked delivery
 Order by 12pm Mon-Fri for same day dispatch
Steep terrain and contours
by Nigel Williams
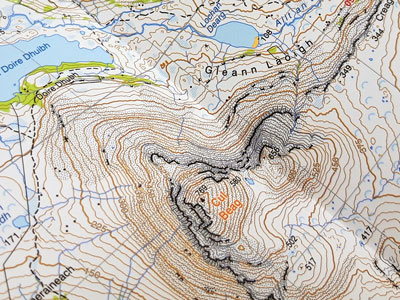
Contour interval
The contour interval is the vertical spacing between contour lines and it varies depending on the map scale and the general area being mapped. OS 1:25,000 maps tend to use a 5m interval until they cover more mountainous areas when they revert to 10m intervals. OS 1:50,000 scale maps will usually use a 10m interval. The numbering on contour lines is merely fitted in where there is room to do so, and, like river names, they are written in random directions.
Every 5th contour line on most maps is printed more boldly and referred to as an "index" contour. Using Naismiths rough formula (it's not a rule) of 4 km per hour and add one minute per contour line ascended will help in planning a day's walk. This is based on a 10m contour interval but actually it works pretty well on HARVEY 15m contour intervals as well. Counting just the index contour lines (for example 5, 10, 15 lines equals 5, 10, 15 mins regardless of the contour interval) is the most efficient method to help calculate time for a Munro walk. When timing in descent, contour lines are ignored and treated as flat ground.
Missing or merged contour lines
Once the ground steepens to around 30º the thin 10 metre contour lines on an OS 1:50,000 map become too close to print and so the thin lines are omitted; they just come to an end until they can be fitted in again.
The closer the contours, the steeper the ground, but between the contours is not always a uniform steepness. To illustrate this, HARVEY maps sometimes use "form lines", just a short section of a dashed contour line between two other contours. It will often be closer to one line than the other indicating an unusual change of steepness. It tends to be used in flatter areas of ground where contours are well spaced. As an example, it might represent an embankment from the edge of an old river flood plain.
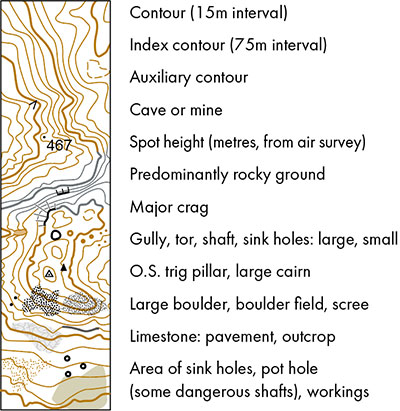
Cliffs and Outcrops
Cliffs should be avoided at all costs unless you are a climber, but a confident Munro bagger can often find a route through a few outcrops.
Peter Cliff, in his book "Mountain Navigation", uses a great cartoon of a hill walker lying on the ground seeing stars having just walked over the edge of a cliff - the thought-bubble saying, "could have sworn it was a cliff - must have been an outcrop". There is a subtle difference between the two and interpretation on the ground can be a little subjective depending on your steep ground confidence.
On OS maps, outcrops are represented by short thin black wavy lines, roughly parallel to the contours, crucially the ends point up the slope. The lines represent the foot and sides of the outcrop, I find this quite representative of an outcrop on a grassy slope. Steep at the front, but peters out up the sides and is usually at a gentle angle rather than vertical from top to bottom. Cliffs, on the other hand, have a black line for the top edge of the cliff with short lines coming off it at right angles going down the slope and represent a significant, often vertical, precipice.
HARVEY maps mark some contours as grey lines to indicate predominantly rocky ground. Interestingly, this often represents ground of around 30º which most walkers would avoid anyway. Depending on the snow cover, altitude and aspect, this can be a useful indication of possible avalanche risk but there are brown lines indicating this angle as well.
One can usually see and find a way over predominantly rocky ground and through outcrops, particularly in ascent. However, in descent, it can be difficult to see what is below you, and outcrops and rocky ground can represent a more significant hazard.
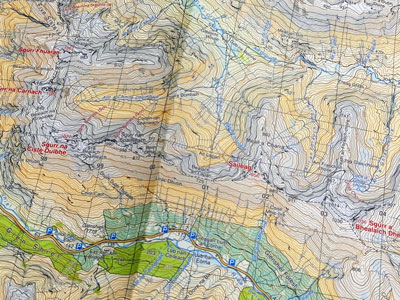
As well as numbers for height, HARVEY maps use colour shading which changes approximately every 150m from sea level. Again, this can be helpful with winter route planning and avalanche avoidance.
If walking on a path up or down a hill, having an altimeter can help pin point your location very quickly where the relevant contour line crosses the path. Using the free OS Locate app, it is often quicker than working out a grid reference if you don't have digital mapping.
GPS altitude readings have a poor level of accuracy compared to positioning information. In steeper areas the signals can be bounced around. As an eminent professor of GPS technology explained we really need readings from the side and below to give us pin point altitude accuracy.
Return to the Navigation Blog