FREE UK tracked delivery
 Order by 12pm Mon-Fri for same day dispatch
Why choose a HARVEY map
There are many unique characteristics to our maps that help them to stand out against the rest. Here, we summarise their key aspects and explain why we think a HARVEY map is perfect for your next adventure.
What detail you can expect from your map
At HARVEY Maps, we have spent more than 45 years perfecting the design and style of our maps so that they are the most useful tool for you when you are outdoors. Our maps are made by walkers for walkers, so you can trust that each and every HARVEY map is made specifically with you in mind.
 HARVEY Maps
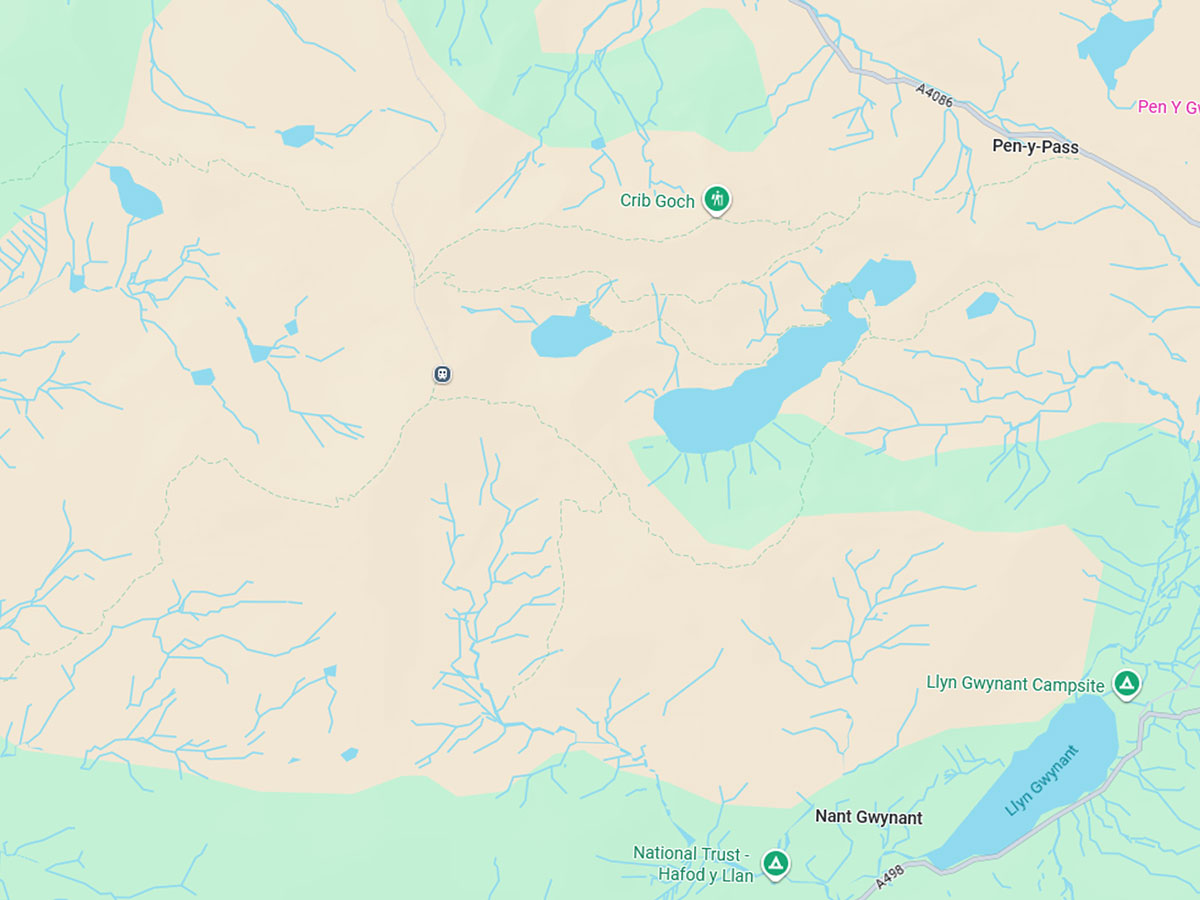 Google Maps
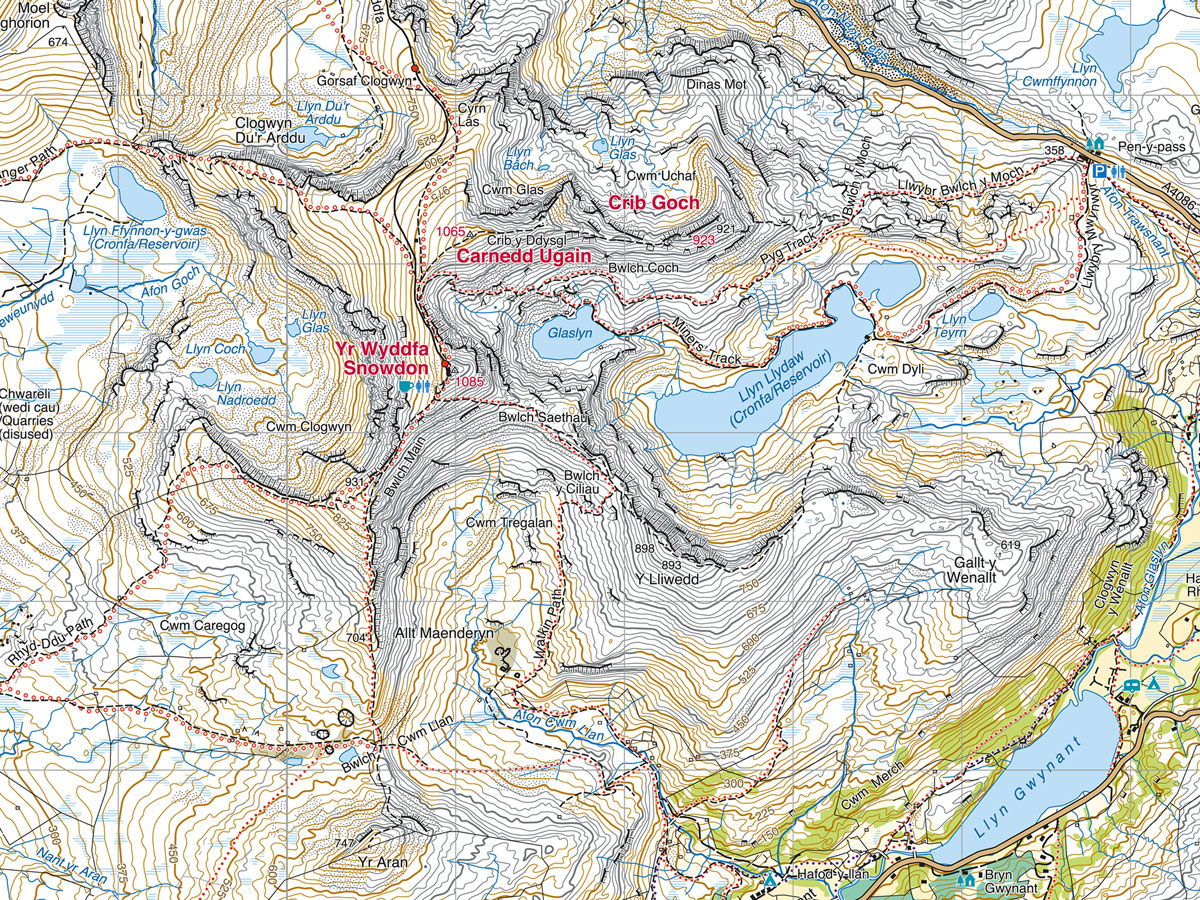
Drag the slider from left to right to compare the qualities of the HARVEY Superwalker 1:25,000 scale Snowdonia North map against a standard Google map base that is freely available.
The symbols we choose are easy to understand
You will see from the image comparison slider above that our mapping is perfectly detailed when compared to other standard, freely available maps. We have drawn your attention to some of the key details you can expect to find on your HARVEY map.
- We use appropriate colours to help you quickly distinguish land use types, such as green for forest, pale yellow for farmland, and no colour where the land is open and higher. Note - you will see that, rather confusingly, green on the Google image does not always mean forest or woodland!
- All the contour lines are drawn manually by our highly skilled team of photogrammetrists instead of being automatically created by a computer. This means we can depict the exact shape of the land, and capture other notable and useful navigational features that may otherwise be missed
- As well as telling you how high you are, contour lines on a HARVEY map also tell you what you can expect to be standing on. Where you see grey contour lines instead of brown, you can expect to be standing on predominantly exposed rock
- Contour lines on a HARVEY map are shown at 15m intervals. This means we can accurately depict the shape of the land even in very steep areas, without compromising the level of detail shown. On other publishers' maps, contour lines in very steep areas are often removed as the lines become drawn too close together
- Crucial features to help keep you safe are always shown, such as steep crags
- All paths and tracks are clearly marked. Our specialist team capture paths that truly exist on the ground. Likewise, if a path does not exist, then it will not be shown
- We avoid cluttering the map for the higher ground - this gives you the clearest picture of the terrain when you need it most
- Rights of Way information gives you confidence in where you can walk, clearly shown in red on our maps
- All of our maps use the National Grid to enable you to accurately give grid references and use your map with your GPS device
To find out more, see the map samples and series information page for more details on the symbols used on our most popular map series.
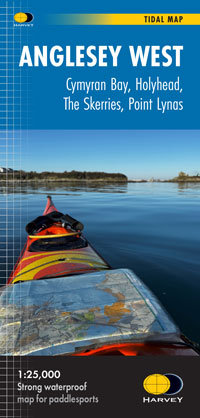
Waterproof as standard
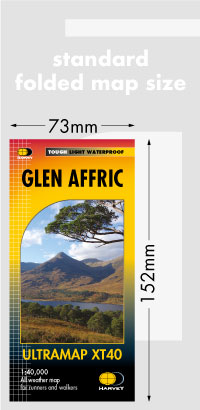
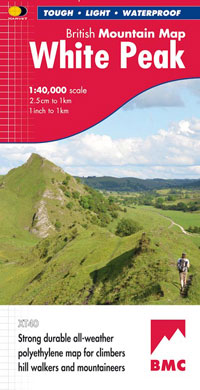
HARVEY maps are all printed on waterproof paper so rain won't spoil your plans. When you see XT40 or XT25 on the front of our maps, you know they are printed on the latest technology available and will withstand all the weather you can throw at them - no need for the map case!
What's more, each map is incredibly lightweight (weighing between 25g and 65g, depending on the series), as well as slim and supple when folded to fit easily into your pocket.
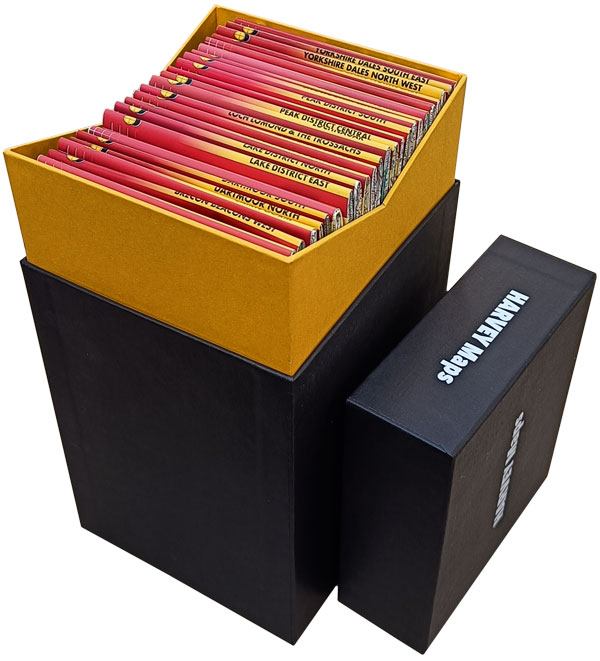
Sensible map coverage
A lot of careful consideration and planning goes into the design of each HARVEY map. We make sure that each map covers a specific and sensible geographic area, so most often your whole walk is on one sheet.
We have you covered
All of our maps are made with you, the user, in mind. You can be confident that when you use a HARVEY map, the ground has been field checked by our enthusiastic and eagle-eyed team of surveyors - this means you can be sure that what you see on the map exists in the real world.
Our specialist and experienced team cover all the facets of the mapmaking process - from photogrammetry right through to survey, marketing and customer service. If you are interested in learning more, take a look at our slideshow of how we make our maps to learn more about the processes involved in producing a map.