FREE UK tracked delivery
 Order by 12pm Mon-Fri for same day dispatch
July 2019 - Contours some historical anecdotes
by Nigel Williams
More than 50 years earlier the concept of lines linking equal elevation values helped create underwater bathymetric charts such as the English Channel in 1737. In those days, with so many ships and men being lost at sea, mapping under water was probably perceived as a priority over land mapping. It is also a lot simpler to make a chart of a channel plotting depth readings using a plumb line, at a series of crossing points, than joining the dots running parallel to the shore giving the shape and steepness of the channel floor. Once on the beach though it was impossible to measure up the way with a plumb line. The first general map with contours appeared in 1791, the French engineer J.L. Dupain-Triel used a mix of contour lines at 20m intervals, hachures and spot heights on a map of France. Contours became established on Ordnance Survey maps in about 1843. All the contours on UK maps were originally drawn by hand from aerial photographs in the first half on the 1900s.
Harvey maps have added to the basic contour information with auxiliary or form line contours, height colouring and contour colouring (grey) to indicate underfoot conditions such as "predominantly rocky ground". They offer the best possible interpretation of the terrain as viewed by the hill walker, mountain biker, or runner on the ground.
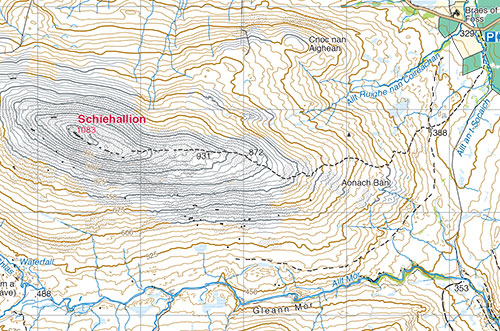
Contours offer the most trustworthy information on maps and provide the 3rd dimension to help us make navigational decisions. Ignore contours and you are automatically cutting out around 30% of valuable information. In winter in the mountains they probably account for over 60% of the information and also have a safety element in terms of reading avalanche terrain.
Between 1897 and 1906 bathymetric (and scientific) surveys of 562 Scottish freshwater lochs were carried out by Sir John Murray, an eminent oceanographer, and a large number of scientists (including his son who died in the process) using the same techniques as in the 1700s - a line from the bank to measure regular intervals and a plumb line for the depth. When the line from the bank got too heavy they resorted to 15 oar strokes between depth soundings. Bartholomew and Son mapped the 60,000 soundings into a series of 223 maps now kept in the National Library in Edinburgh. Modern soundings have proved them to be remarkably accurate; just 24m out for Loch Ness, for instance. Rather like the measurements taken of Schiehallion, this enabled calculations of volume etc to be made and was a world first survey of its kind.
From around 1865 to 1895 the British military in India were mapping the Himalayas with the help of Indian spies known as "Pundits" in the "Great Game" against the perceived Russian threat to the north - a brilliant piece of history made popular through Rudyard Kipling’s, Kim. They were intelligent men, often school teachers, and their work was celebrated by the RGS and a few even met Queen Victoria. The Pundits would attach themselves to trading caravans pretending to be merchants or Holy men. In addition to pacing using a set of rosary beads and a hidden compass in the top of a prayer wheel, altitude was measured secretly with a thermometer by recording the boiling point of water at natural stops in villages or the top of a pass. The last British spy master controlling the exploration and mapping apparently died in 1964 which adds a bit of perspective.
The 1930s re-triangulation of Great Britain developed the use of trig points. Initially there were over 6,500 but many have been lost to building development or have been removed. Around 25 years ago they became obsolete as satellites and GPS could now do the job. However, when Ordnance Survey announced they would remove them there was an outcry from the walking public and they were left in place to be adopted and maintained by local walking groups. I suspect if any organisation announced that they were going to erect thousands of concrete pillars on hill tops and other prominent places around the UK there would be a massive outcry against them.
Return to the Navigation Blog